Understanding Benefits of Continuous Glucose Monitoring
Remember our discussion about glycation—that slow “rusting” process where excess glucose gradually damages proteins throughout your body? Your HbA1c test gives you a valuable 2-3 month average of your glucose level that estimates how much damage there is, like checking how much rust has accumulated on a bridge over time. But what if you could watch the rusting process in real-time and actually prevent it from happening?
That’s exactly what continuous glucose monitoring (CGM) offers: a window into the moment-by-moment glucose fluctuations that your HbA1c average can’t reveal.
The Hidden Story Behind Your Average
Imagine two people, both with an HbA1c of 5.2%. Person A maintains steady glucose levels around 80-100 mg/dL most of the time every day and rarely goes above 120 mg/dL. Person B swings wildly between 70 mg/dL and 170 mg/dL throughout the day each time they eat or snack. Their averages look identical, but their “rusting” patterns are completely different.
Person A’s steady levels create minimal glycation damage—like keeping metal in a consistently dry environment with a low chance of rusting. Person B’s glucose spikes are like repeatedly soaking that same metal in saltwater and exposing it to the elements to rust. Person B’s metal will rust much faster due to the repeated exposure cycles.
This is why CGM data can be revelatory even for people with “normal” HbA1c levels. You might discover that your seemingly healthy average masks significant glucose spikes that are accelerating protein damage throughout your body.
Discovering Your Personal Glucose Fingerprint
CGM reveals patterns that are impossible to detect with traditional testing:
**The Dawn Phenomenon Discovery:** You might learn that your glucose naturally rises 20-30 mg/dL every morning due to cortisol release, even before eating. This knowledge helps you understand why you feel energetic some mornings and sluggish others.
**Food Response Profiling:** That “healthy” oatmeal breakfast might spike your glucose to 180 mg/dL for two hours, while eggs and avocado keep you steady at 95 mg/dL. Your body’s response to identical meals can vary dramatically based on sleep, stress, exercise timing, and even the order in which you eat different foods.
**Stress and Sleep Correlations:** CGM often reveals that poor sleep or high stress days create glucose instability even when your diet remains constant. You might discover that your glucose stays elevated for hours after a stressful meeting or that sleeping less than six hours makes you glucose-intolerant the next day.
Insulin Sensitivity: The Real-Time Laboratory
Your glucose response patterns tell the story of your insulin sensitivity in unprecedented detail. Healthy insulin sensitivity looks like:
- Glucose peaks no higher than 120-140 mg/dL after meals
- Return to baseline within 2-3 hours
- Minimal glucose variability (standard deviation under 15 mg/dL)
- Stable overnight levels
When insulin sensitivity begins declining—often years before it shows up in standard lab tests—CGM catches the early warning signs:
- Glucose peaks above 140 mg/dL becoming more frequent
- Delayed return to baseline (taking 3-4 hours instead of 2)
- Increased glucose variability throughout the day
- Morning glucose levels gradually trending upward over weeks
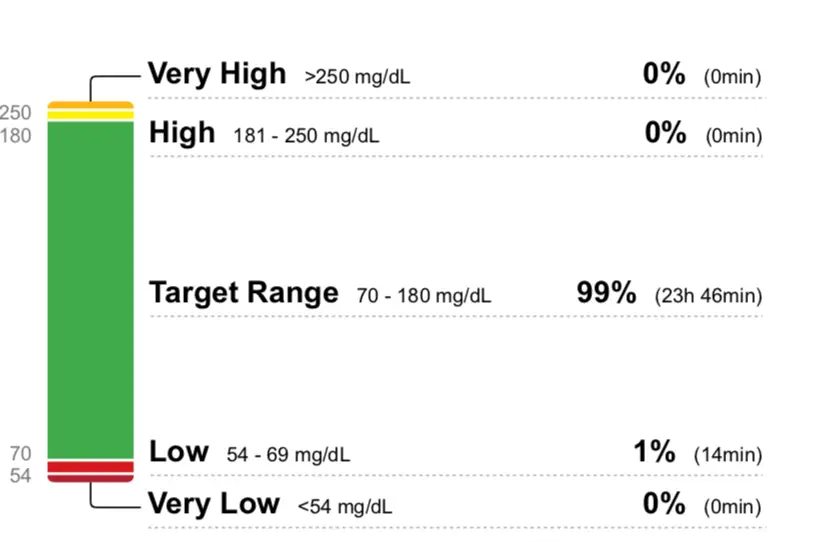
The Time-in-Range Revolution
While HbA1c gives you an average over 2-3 months, CGM introduces the concept of “time-in-range”—the percentage of time your glucose stays between 70-140 mg/dL (or whatever range you choose). Research suggests that time-in-range may be more predictive of complications than HbA1c averages.
Think of it this way: spending 80% of your time with glucose between 80-110 mg/dL creates far less glycation damage than spending 60% at 90 mg/dL and 40% at 160 mg/dL, even if both scenarios produce similar averages.
This metric becomes particularly powerful for optimization. You can experiment with meal timing, food combinations, exercise, and sleep patterns while watching their real-time impact on your time-in-range percentage.
Metabolic Flexibility Insights
CGM reveals your metabolic flexibility—how well your body switches between burning glucose and fat for fuel. People with good metabolic flexibility show:
- Stable glucose during fasting periods
- Quick glucose clearance after meals
- Minimal glucose rise during moderate exercise
- Stable overnight glucose levels
Poor metabolic flexibility appears as:
- Glucose remaining elevated between meals
- Large glucose swings with small dietary changes
- Glucose rising during exercise (indicating over-reliance on glucose vs. fat burning)
- Erratic overnight patterns
The Glycation Prevention Strategy
Armed with CGM data, you can develop personalized strategies to minimize glycation damage:
- Meal Sequencing: Eating protein and vegetables before carbohydrates often reduces glucose spikes by 20-30%. CGM lets you test this strategy with your specific meals and body.
- Exercise Timing: A 10-minute walk after meals can dramatically blunt glucose spikes. CGM shows you exactly how much and helps you find the optimal timing and intensity.
- Sleep Optimization: You might discover that going to bed with glucose above 110 mg/dL leads to poor sleep and elevated morning glucose, creating a cycle of metabolic dysfunction.
- Stress Management: Watching glucose rise during stressful periods provides immediate feedback on the metabolic cost of chronic stress and the benefits of stress-reduction techniques.
Beyond Prevention: Performance Optimization
Many people discover that glucose stability correlates strongly with:
- Mental clarity and focus
- Energy consistency throughout the day
- Exercise performance and recovery
- Mood stability
- Sleep quality
CGM transforms glucose management from reactive (treating high averages) to proactive (optimizing real-time patterns for both current performance and long-term health).
Perfect? No….
CGM isn’t perfect. It measures glucose in tissue fluid, not blood, with a slight delay. It can be influenced by hydration, certain medications, and sensor placement. Most importantly, glucose levels are just one piece of the metabolic health puzzle.
However, for understanding your personal glucose patterns and their relationship to diet, exercise, sleep, and stress, CGM provides insights that simply aren’t available through traditional testing methods.
Making CGM Actionable
The goal isn’t perfect glucose control—it’s understanding your body’s unique responses and optimizing them for both immediate wellbeing and long-term health. CGM provides the real-time feedback loop that makes sustainable lifestyle changes possible.
Your HbA1c tells you about the rust that’s already accumulated. CGM helps you watch the rusting process as it happens and gives you the power to prevent it. In the world of metabolic health, that real-time insight might be the difference between gradual decline and sustained vitality as you age.
The technology has evolved from a medical necessity for diabetics to a powerful optimization tool for anyone serious about understanding and improving their metabolic health. The question is: are you ready to see what your glucose is really doing throughout the day?
Learn more about CGM monitors
You can learn more about how CGM sensors work, what it’s like to wear one, and how you can get one here:
Check out the “Services” page to learn more about how Carla can help you achieve your goals.